Animal growth... but make it quantitative
People have studied growth in a multitude of organisms from unicellular models like bacteria and yeast, to animal models like drosophila and mice. To assess what developmental growth looks like for any one of these organisms is relatively straightforward; the more challenging — and inherently more interesting — question lies in HOW is growth regulated. The idea is that animal size and food intake are related (you must eat to get bigger). The piece that is a little harder to determine is how that nutrient energy is used.
I am particularly invested in the advantages provided by studying C. elegans to answer questions about growth and it’s regulation. By quantitatively studying feeding behavior and changes in animal size, I aim to address what growth looks like, and also gain a bit of insight into growth regulation.
Traditional methods for measuring C. elegans size during development rely on manual analyses, requiring researchers to collect images of animals and use image analysis software to obtain measurements of size – this can be a bottleneck to perform the large-scale quantitative experiments that are needed to capture and analyze population growth dynamics. We developed a protocol that directly integrates an image-based phenotyping strategy with a large-particle flow cytometer to precisely evaluate changes in animal size and morphology at high replication.
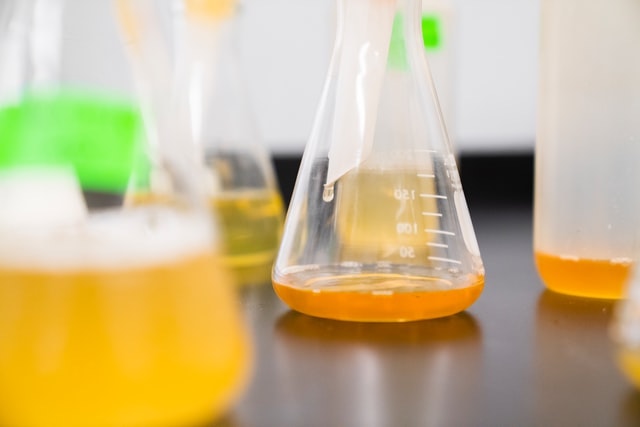
I first synchronize hundreds of thousands of C. elegans in multiple flasks so that they begin at the same age. Next I add food. After the addition of food animals begin eating and subsequently growing. In order to measure their growth, each hour I perform 5 steps:
- I remove a sample of animals from each flask.
- To this sample I add fluorescent beads. Being the approximate size of the bacteria C. elegans consume, these beads give us information about feeding behavior.
- I transfer a small volume to multiple wells of a new plate. Each well contains ~30 animals.
- I acquire images to actually see how the animals are developing.
- I collect measurements of size and fluorescence using a large-particle flow cytometer.

Repeating this process for every hour of development gives me image data like this:

And raw size data that looks like this:
 Each point is an individual measured animal, with ~2000 measurements at every hour!
Now the challenge is making sense of these data to learn something new about growth during development.