Model selection and its many trials

Model selection is the process of selecting one statistical model from a set of many candidate models. It seems relatively straightforward in principal but in practice (especially with noisy experimental data) it can be challenging.
My research is focused on understanding how organisms coordinate developmental progression and growth rate to reach an appropriate adult size. To understand how this is achieved in C. elegans, I must first examine how C. elegans grow. Two general models were proposed for C. elegans growth in volume: linear and exponential.
It is important to note that these volume growth models require different dynamics in length and width.
- For linear volume growth, length and width must increase at precise sublinear rates that together result in a linear increase in volume.
- If animal length and width increased at a constant linear rate, then volume would increase at a cubic rate.
- If both length and width grew exponentially, then volume would fit an exponential model.
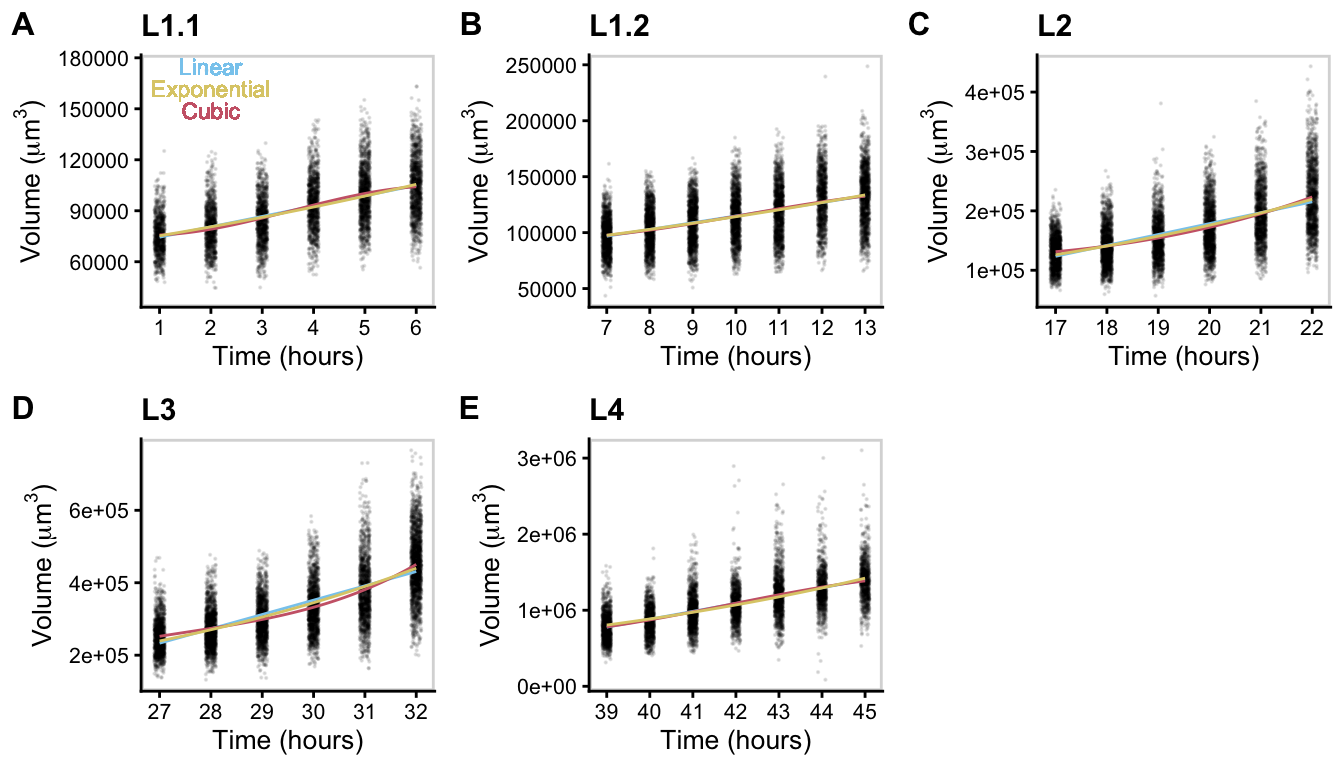
I sought to identify which model best described C. elegans growth behavior. To start I fit linear, exponential, and cubic functions to the data using least-squares regression. I do this for all 4 larval stages: L1, L2, L3, and L4. You will notice that L1 was further divided into two sections, this is due to the small volume drop we observe mid stage.
linear <- lm(volume~hour)
exponential <- nls(volume~ I(exp(1)^(m*hour + b)), start = list(m = 0.08, b = 5))
cubic <- lm(volume~poly(hour, degree = 3))
Given these fits, its time for model selection! I used Akaike’s information criterion (AIC) and Bayesian information criterion (BIC) as goodness of fit criteria to evaluate the candidate models. In short, I want to find the model with the smallest AIC/BIC and compare it to the other candidate models
If the delta value was greater than 6, the model with the smallest AIC/BIC value was denoted as the best model. If the delta value was less than 6 but greater than 2, the model with the smallest AIC/BIC value was determined to likely be the best model. If the delta value was less than 2, we are unable to distinguish the model of best fit.
AIC | BIC | Delta_AIC | Delta_BIC | |||||||||||
|---|---|---|---|---|---|---|---|---|---|---|---|---|---|---|
Stage | Linear | Exponential | Cubic | Linear | Exponential | Cubic | Linear | Exponential | Cubic | Linear | Exponential | Cubic | Best model by AIC | Best model by BIC |
| L1.1 | 138159 | 138163 | 138142 | 138179 | 138184 | 138175 | 17 | 21 | 0 | 4 | 9 | 0 | Cubic | Likely Cubic |
| L1.2 | 193414 | 193416 | 193412 | 193435 | 193437 | 193447 | 2 | 4 | 0 | 0 | 2 | 12 | Can't distinguish | Can't distinguish |
| L2 | 189190 | 189091 | 189048 | 189211 | 189111 | 189083 | 142 | 43 | 0 | 128 | 28 | 0 | Cubic | Cubic |
| L3 | 211208 | 210979 | 210834 | 211229 | 211000 | 210869 | 374 | 145 | 0 | 360 | 131 | 0 | Cubic | Cubic |
| L4 | 183027 | 183067 | 183023 | 183047 | 183087 | 183057 | 4 | 44 | 0 | 0 | 40 | 10 | Likely Cubic | Linear |
As you can see, it is difficult to consistently distinguish between linear, exponential, and cubic models using statistical information criterion because of the similarity in the shapes of the growth curves. This is not entirely surprising as it is well understood that distinguishing between linear and exponential growth requires highly accurate measurements. From these results, however, one could conclude that volume growth likely proceeds at a rate faster than linear. This is particularly interesting as recent work has suggested that C. elegans do in fact grow at a rate faster than linearly within larval stages.