ggPlot 'Em All!

I’ve been looking for ways to apply the R tools I use to fun data outside my research, so when I happened to stumble across the Pokémon dataset I thought… what better way to dig into some Pokémon stats than with tidyverse!
This dataset contains a treasure trove of information on 801 Pokémon from all seven generations. Let’s see what we’re working with:
rmarkdown::paged_table(pokemon[1:6,])
Now the ever challenging question of where to begin?? First I’ll plot the frequency of each type:
pokemon %>%
  ggplot() +
  aes(y = reorder(type1, n)) +
  geom_bar(fill = "darkblue") +
  scale_x_continuous(breaks = seq(0,120,5)) +
  theme_bw() + labs(y = "Pokémon Type")
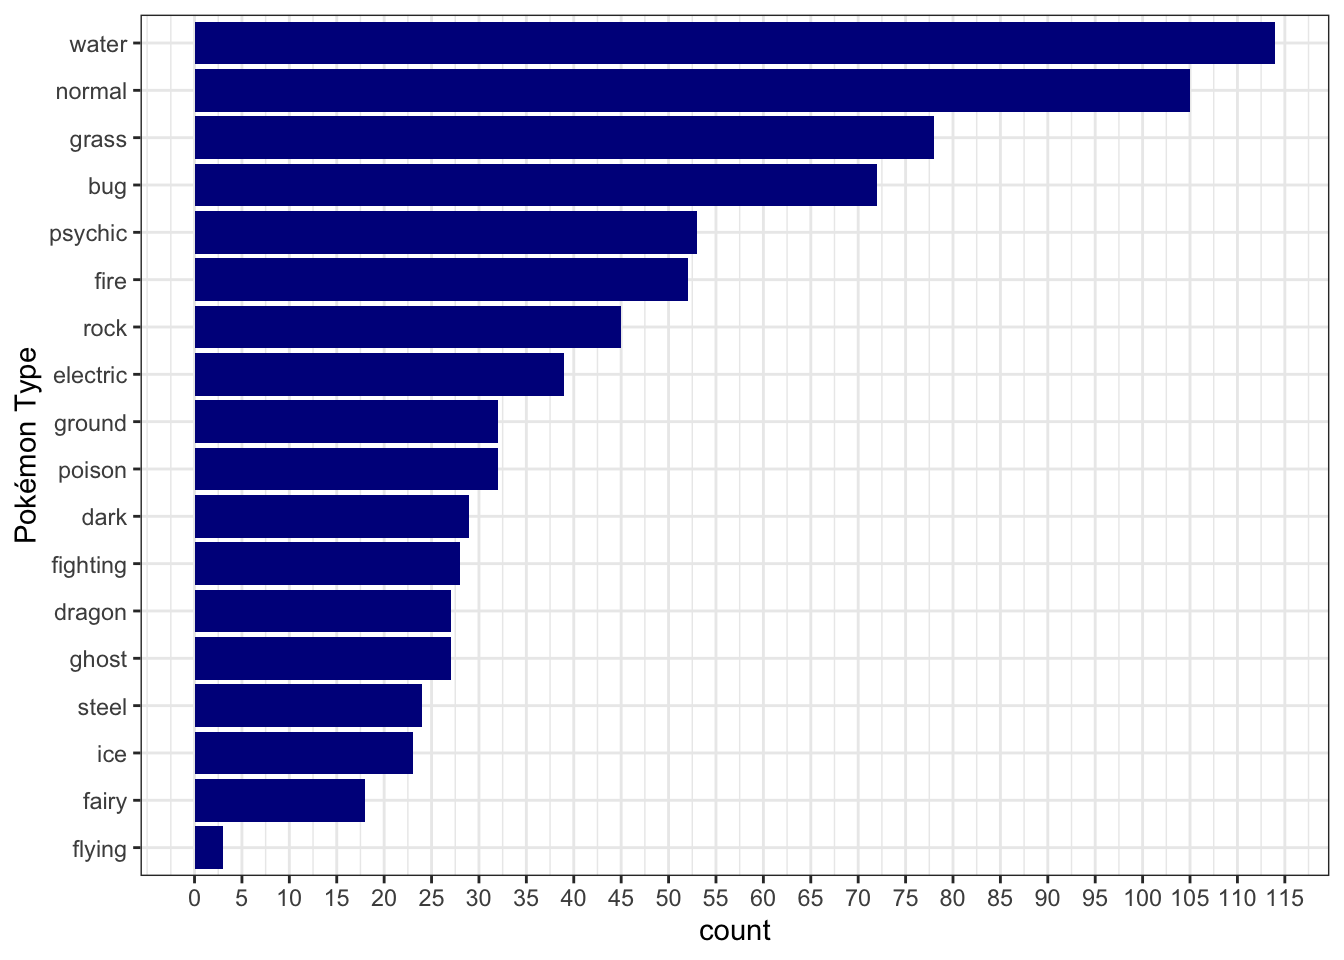 Neat - the most common Pokémon type is water while the least common is flying. This, however, combines information about Legendary Pokémon. Legendary Pokémon are a group of incredibly rare and powerful Pokémon. But just how rare are they?
pokemon %>%
  dplyr::count(is_legendary) %>%
  dplyr::mutate(prop = n/sum(n)) %>%
  knitr::kable()
| is_legendary | n | prop |
|---|---|---|
| FALSE | 731 | 0.9126092 |
| TRUE | 70 | 0.0873908 |
| Looks like there are only 70 legendaries out of 801 Pokémon - quite the minority at only ~9% of the population. |
Now to explore some characteristics. First I’ll plot the relationship between height and weight while highlighting Pokémon classified as legendary.
pokemon %>%
  ggplot(aes(x = height_m, y = weight_kg)) +
  geom_point(aes(color = is_legendary), size = 2) +
  geom_text(aes(label = ifelse(height_m>7.5|weight_kg>600, as.character(name), '')),
            vjust = 0, hjust = 0) +
  geom_smooth(method = "lm", se = FALSE, col = "black", linetype = "dashed") +
  expand_limits(x=16) +
  labs(title = "Legendary Pokémon by height and weight",
       x = "Height (m)",
       y = "Weight (kg)") +
  guides(color = guide_legend(title = "Pokémon status")) +
  scale_color_manual(labels = c("Non-Legendary", "Legendary"),
                     values = c("#0072B2", "#D55E00")) +
  theme_bw()
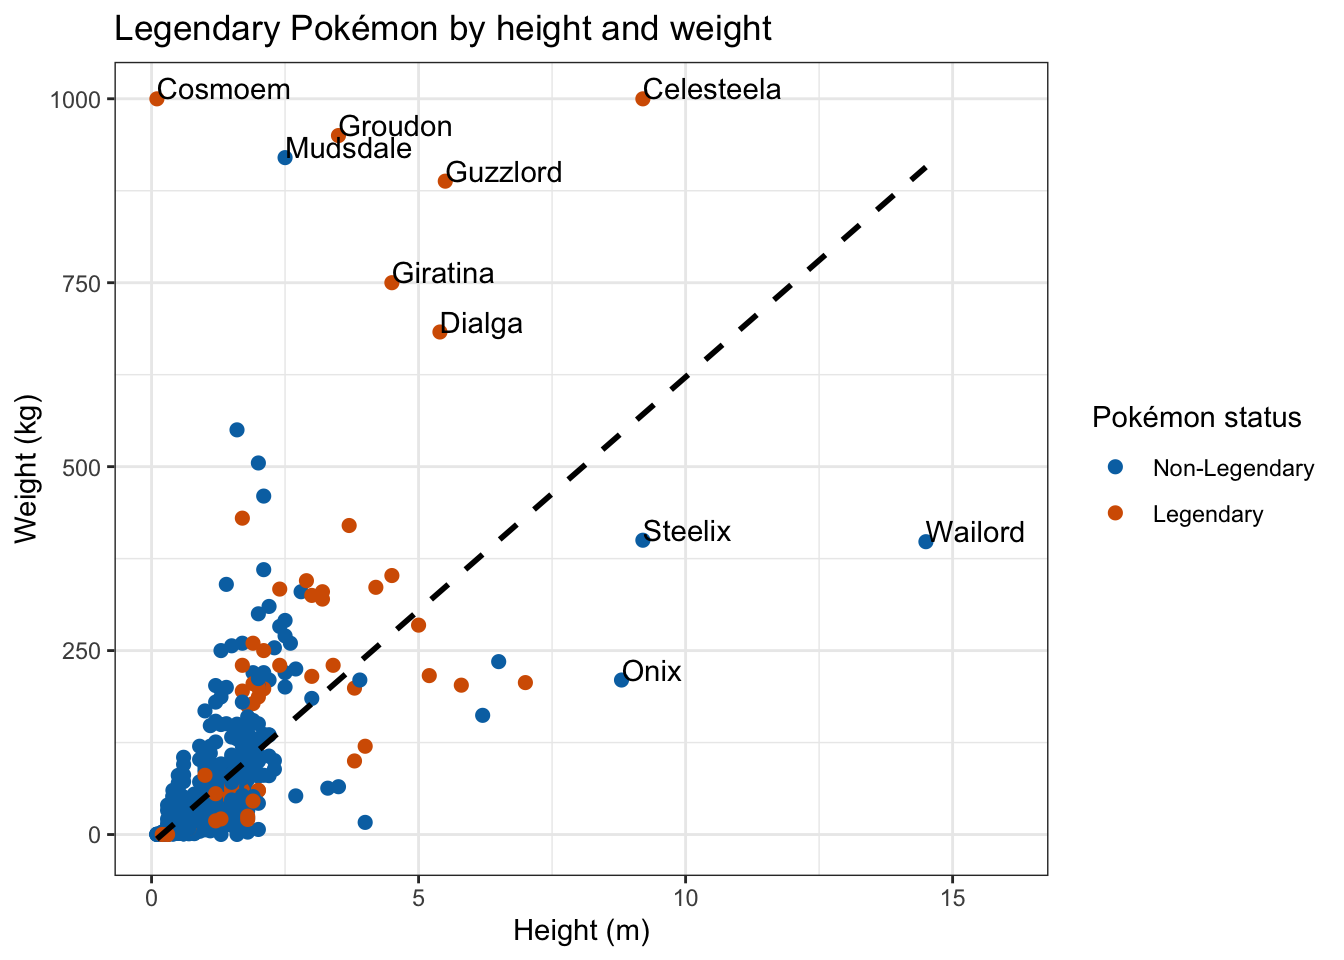 It looks like, generally, legendary Pokémon are heavier and taller but there are still some exceptions. Onix, Steelix, and Wailord are not legendary status yet are still rather large. I wonder if this trend is maintained across other characteristics.
pokemon %>%
  select(is_legendary, attack, sp_attack, defense, sp_defense, hp, speed)  %>%
  gather(key = fght_stats, value = value, -is_legendary) %>%
  ggplot() +
  aes(x = is_legendary, y = value, fill = is_legendary) +
  geom_boxplot(varwidth = T) +
  facet_wrap(~fght_stats, nrow = 2) +
  scale_fill_manual(labels = c("Non-Legendary", "Legendary"),
                     values = c("#0072B2", "#D55E00")) +
  labs(title = "Pokemon fight statistics",
        x = "Legendary status") +
 guides(fill = FALSE) + theme_bw()
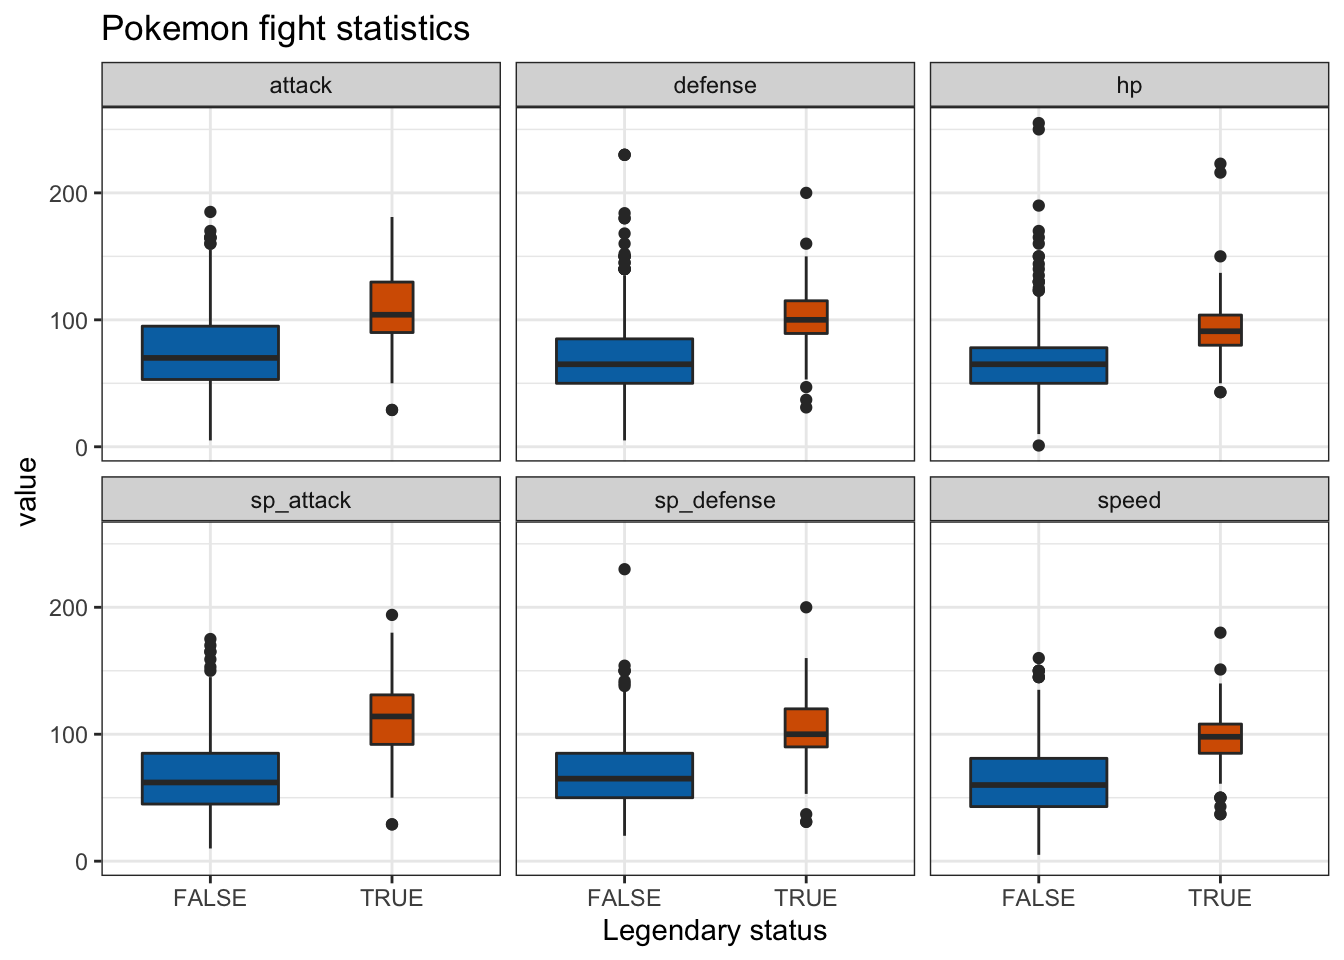
Not surprisingly, legendary Pokémon outperform their ordinary counterparts in fighting stats. However, there are outliers in both groups indicating some ordinary Pokémon are anomalously strong while some legendaries are anomalously weak.
The last thing I will do is build a classification tree to understand what makes a Pokémon legendary. I just recently was introduced to working with tree-based models in R thanks to this DataCamp course.
First, I will split the data into a training set and a test set.
set.seed(5525)

n <- nrow(pokemon)

sample_rows <- sample(n, (0.6*n))

pokemon_train <- pokemon  %>%
  filter(row_number() %in% sample_rows)

pokemon_test <- pokemon  %>%
  filter(!row_number() %in% sample_rows)
Now I will fit a simple classification decision tree. This will give me a graphical representation of the model.
set.seed(5525)

model_tree <- rpart(is_legendary ~ attack + defense + height_m +
                    hp + sp_attack + sp_defense + speed + type1 + type2 + weight_kg,
                       data = pokemon,
                       method = "class",
                       na.action = na.omit)

rpart.plot(model_tree)
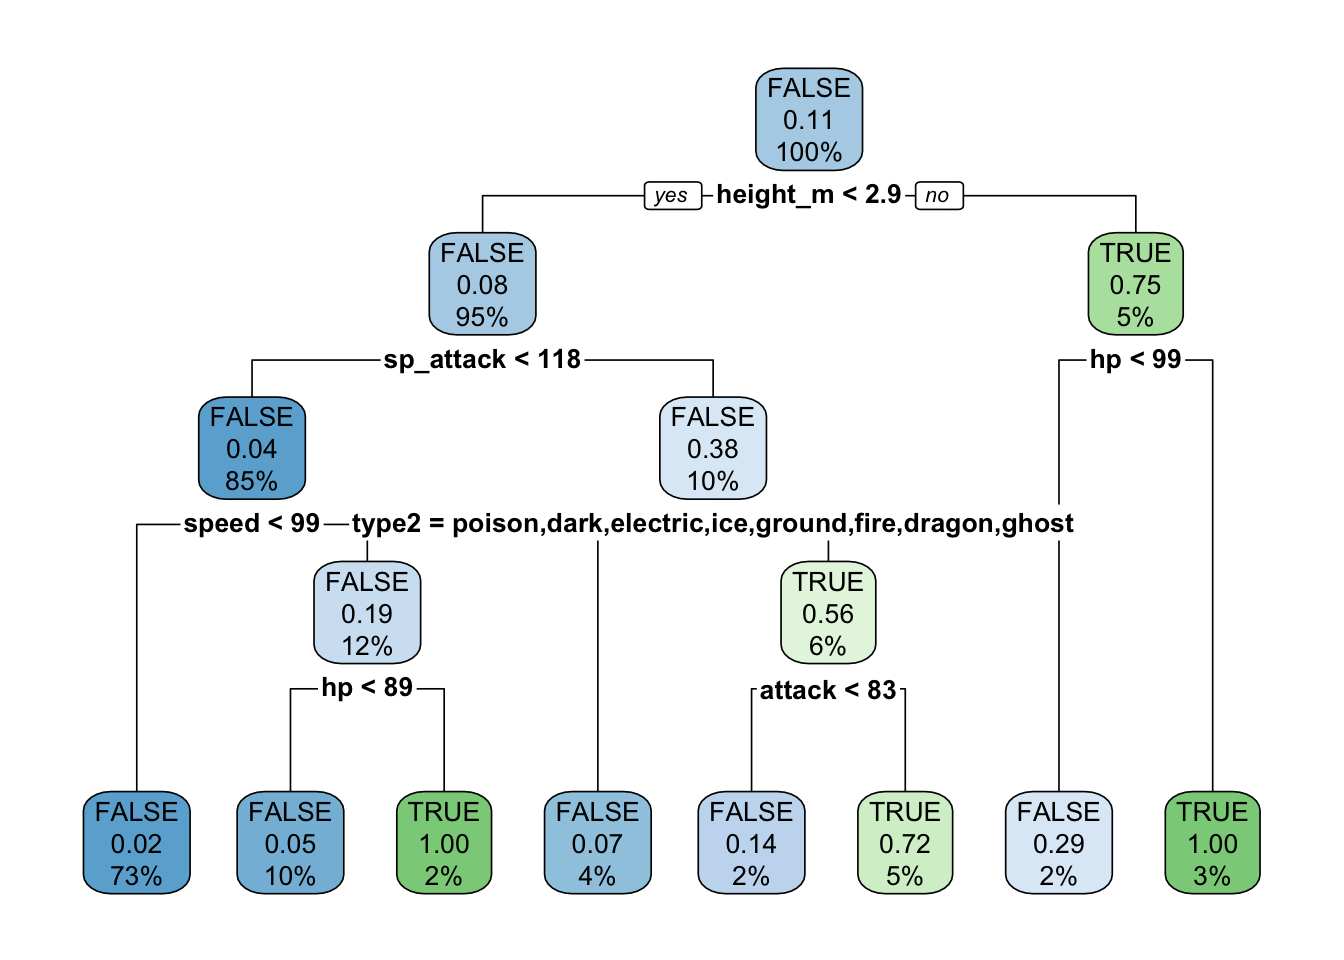 You will notice several nodes in the tree. Each node shows the predicted class (legendary vs non-legendary) as TRUE or FALSE. It also shows the probability of being legendary and below that, the percentage of Pokémon that are in that node. Take the bottom right node for example - those Pokémon with a height_m > 2.9 and hp > 99 - this represents only 3% of Pokémon in the training set and predicts that each has a 100% chance of being legendary.
On the other hand, the bottom-left node (height_m < 2.9, sp_attack < 188, and speed < 99) represents 73% of Pokémon in the training set and predicts that each only has a 2% chance of being legendary.
Decision trees exclude any variables they don’t find to be useful and place the remaining most important variables at the top. So in this case, height_m occupies node 1 while defense, sp_defense, weight_kg, and type1 are all excluded.
I had a pretty fun time taking a break from my typical data analysis to dig into this fun dataset a bit. If you want to try out something like this check out the project page on DataCamp!